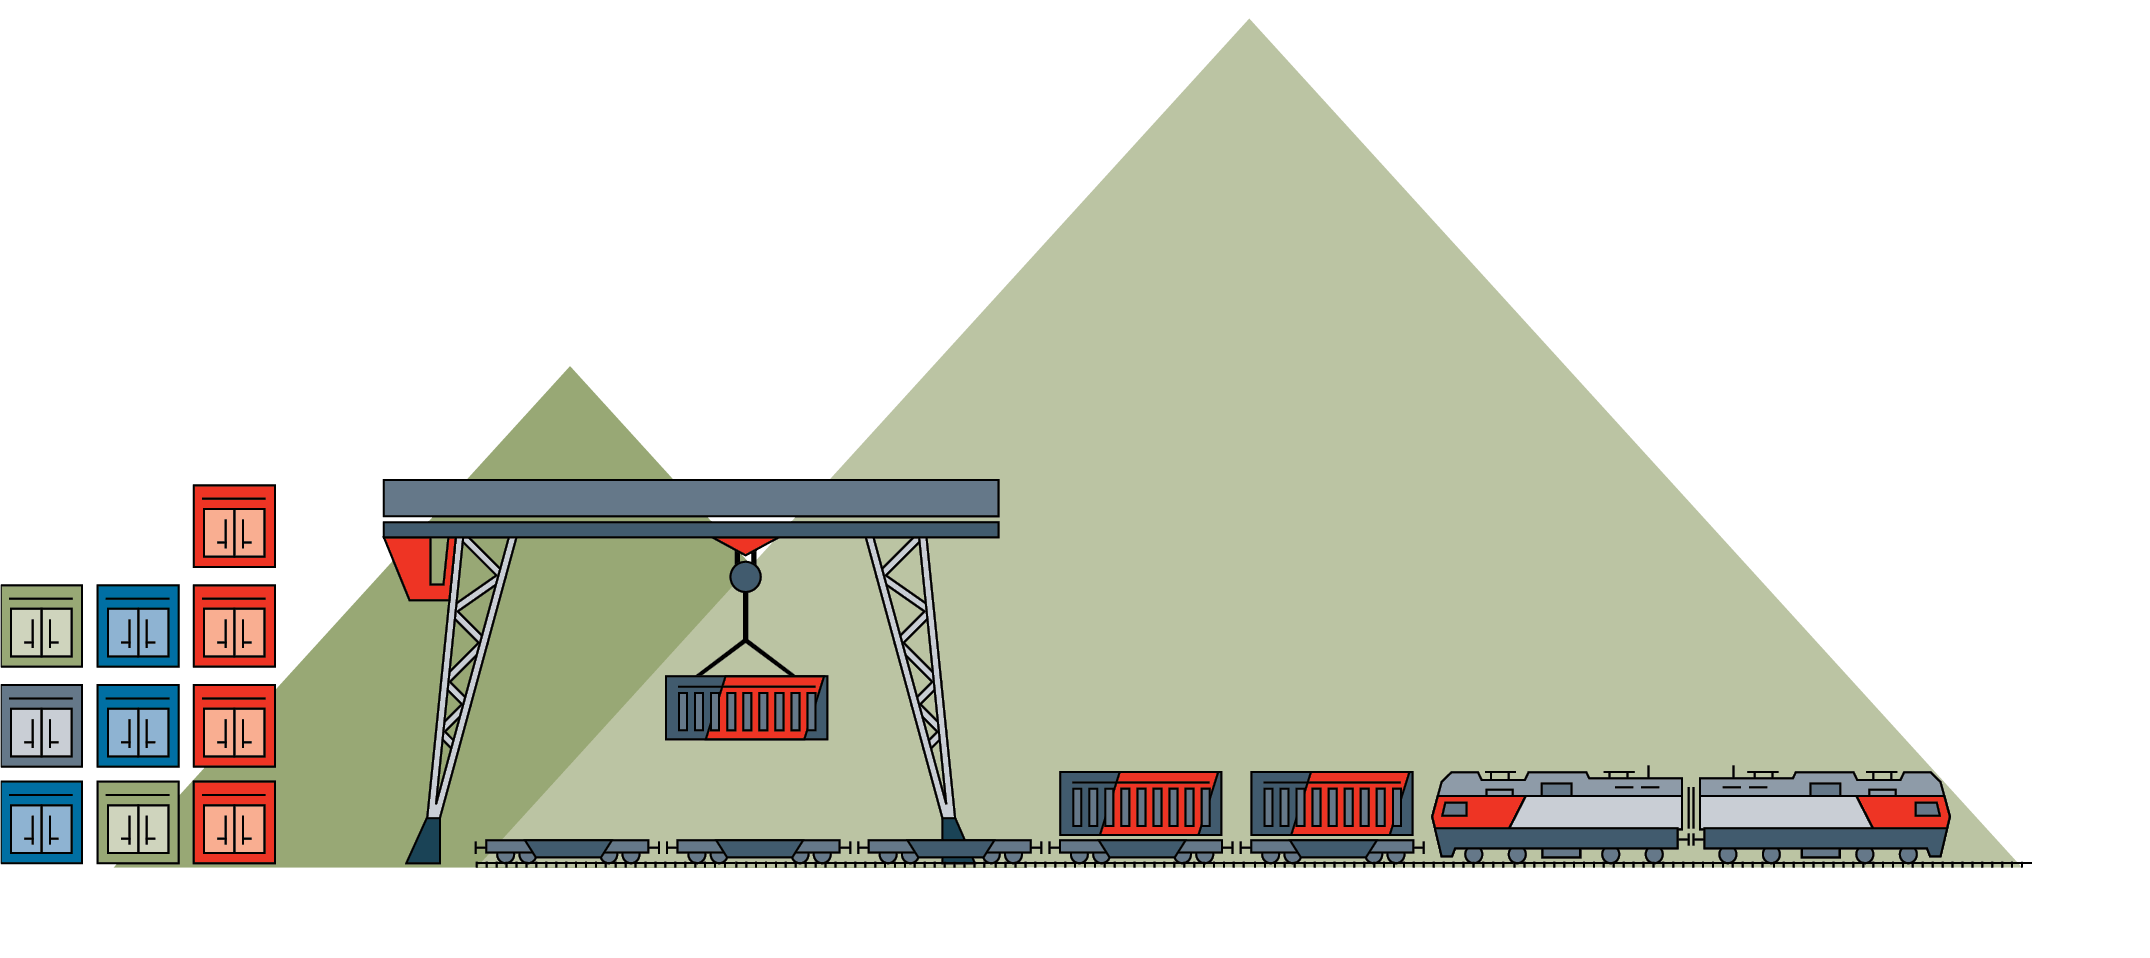
Freight transportation using Russian Railways infrastructure
On the path to change

Russian Railways is working to improve the quality of services and increase freight transportation speed. In 2015, more than 9,000 expedited container trains were dispatched, which demonstrates the demand for such services. Freight delivery reliability increased 5.4%. More than 23,000 freight trains operated with agreed departure and arrival times, a 59% increase from 2014.
The efforts made by Russian Railways to improve transportation process technologies as well as plans to expand the practice of using tariff corridors are aimed at attracting additional freight volumes from alternative transportation modes to the railway.
Based on materials from the final meeting of the Russian Railways Management Board
| Indicator | Measurement unit | 2011 | 2012 | 2013 | 2014 | 2015 | |
|---|---|---|---|---|---|---|---|
| value | % | ||||||
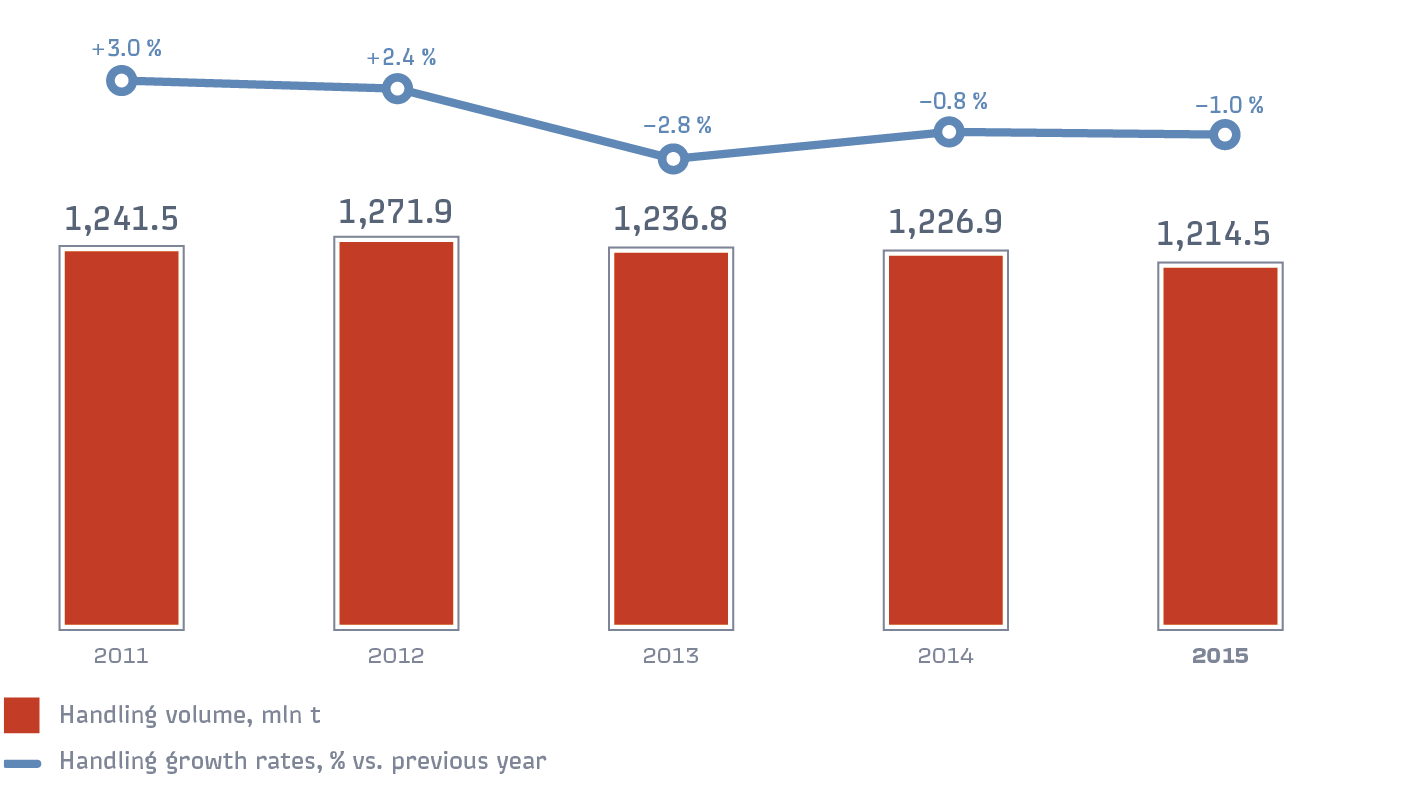
| Handling | mln t | 1,241.5 | 1,271.9 | 1,236.8 | 1,226.9 | 1,214.5 | –1.0 % |
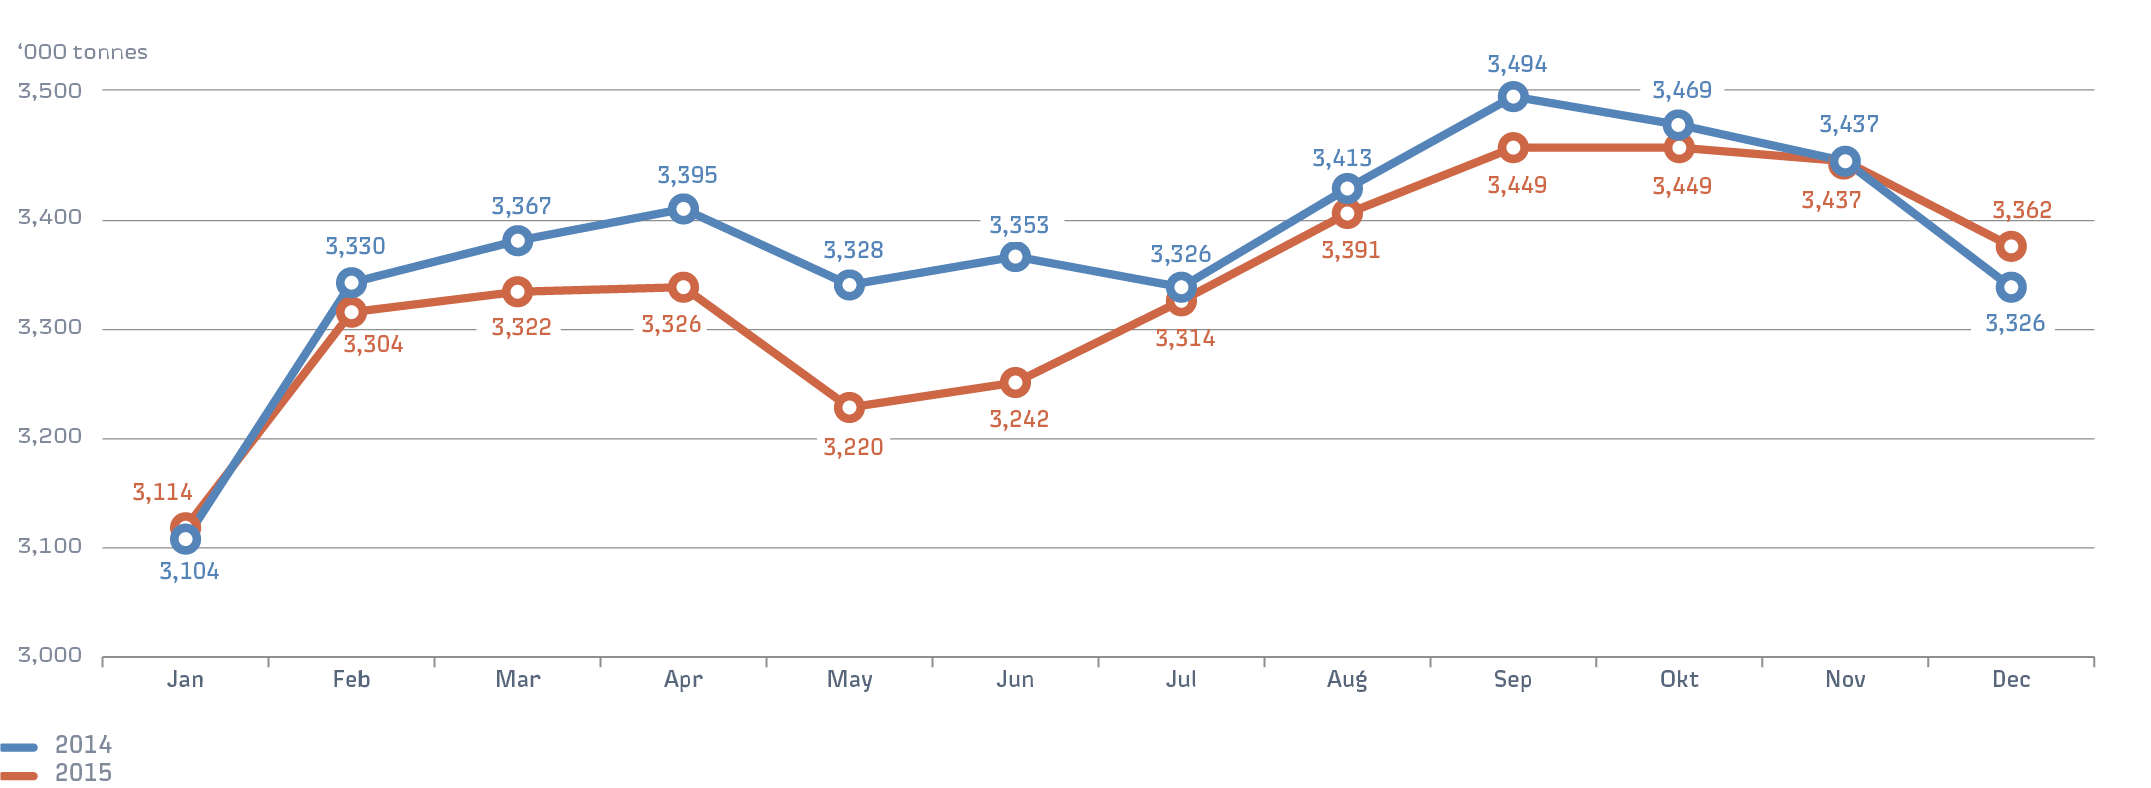
| average per day | ‘000 t | 3,401.5 | 3,475.0 | 3,388.5 | 3,361.5 | 3,327.3 | –1.0 % |
| Overall freight turnover, including: | bln tkm | 2,704.8 | 2,782.6 | 2,813.1 | 2,954.5 | 2,954.9 | 0.01 % |
| loaded freight turnover | bln tkm | 2,127.8 | 2,222.4 | 2,196.2 | 2,298.6 | 2,304.8 | 0.3 % |
| empty freight turnover | bln tkm | 576.9 | 560.2 | 616.9 | 655.9 | 650.1 | –0.9 % |
| Proportion of shipments delivered by the required (contractual) date | % | 81.6 | 72.5 | 77.5 | 87.1 | 92.9 | 5.8 p. p. |
Activities of the business unit
The Transportation and Logistics Business Unit was established to consolidate the Group’s competencies in organising the transportation process and in logistics activities, including organising freight traffic, the range of freight handling services and customer relations.
The business unit performs the following types of activities:
- the provision of rolling stock operation services;
- the provision of work and services at terminal and warehouse facilities, including handling work, freight storage and warehouse processing, and preparing railcars for shipment;
- the development of terminal and logistics centres;
- the provision of integrated transportation and logistics services (3PL/4PL segment).
- the organisation of railway-ferry transportation;
- the development and implementation of measures to attract freight from other types of transportation to railway, including through the use of a tariff corridor and the introduction of new services.
Handling
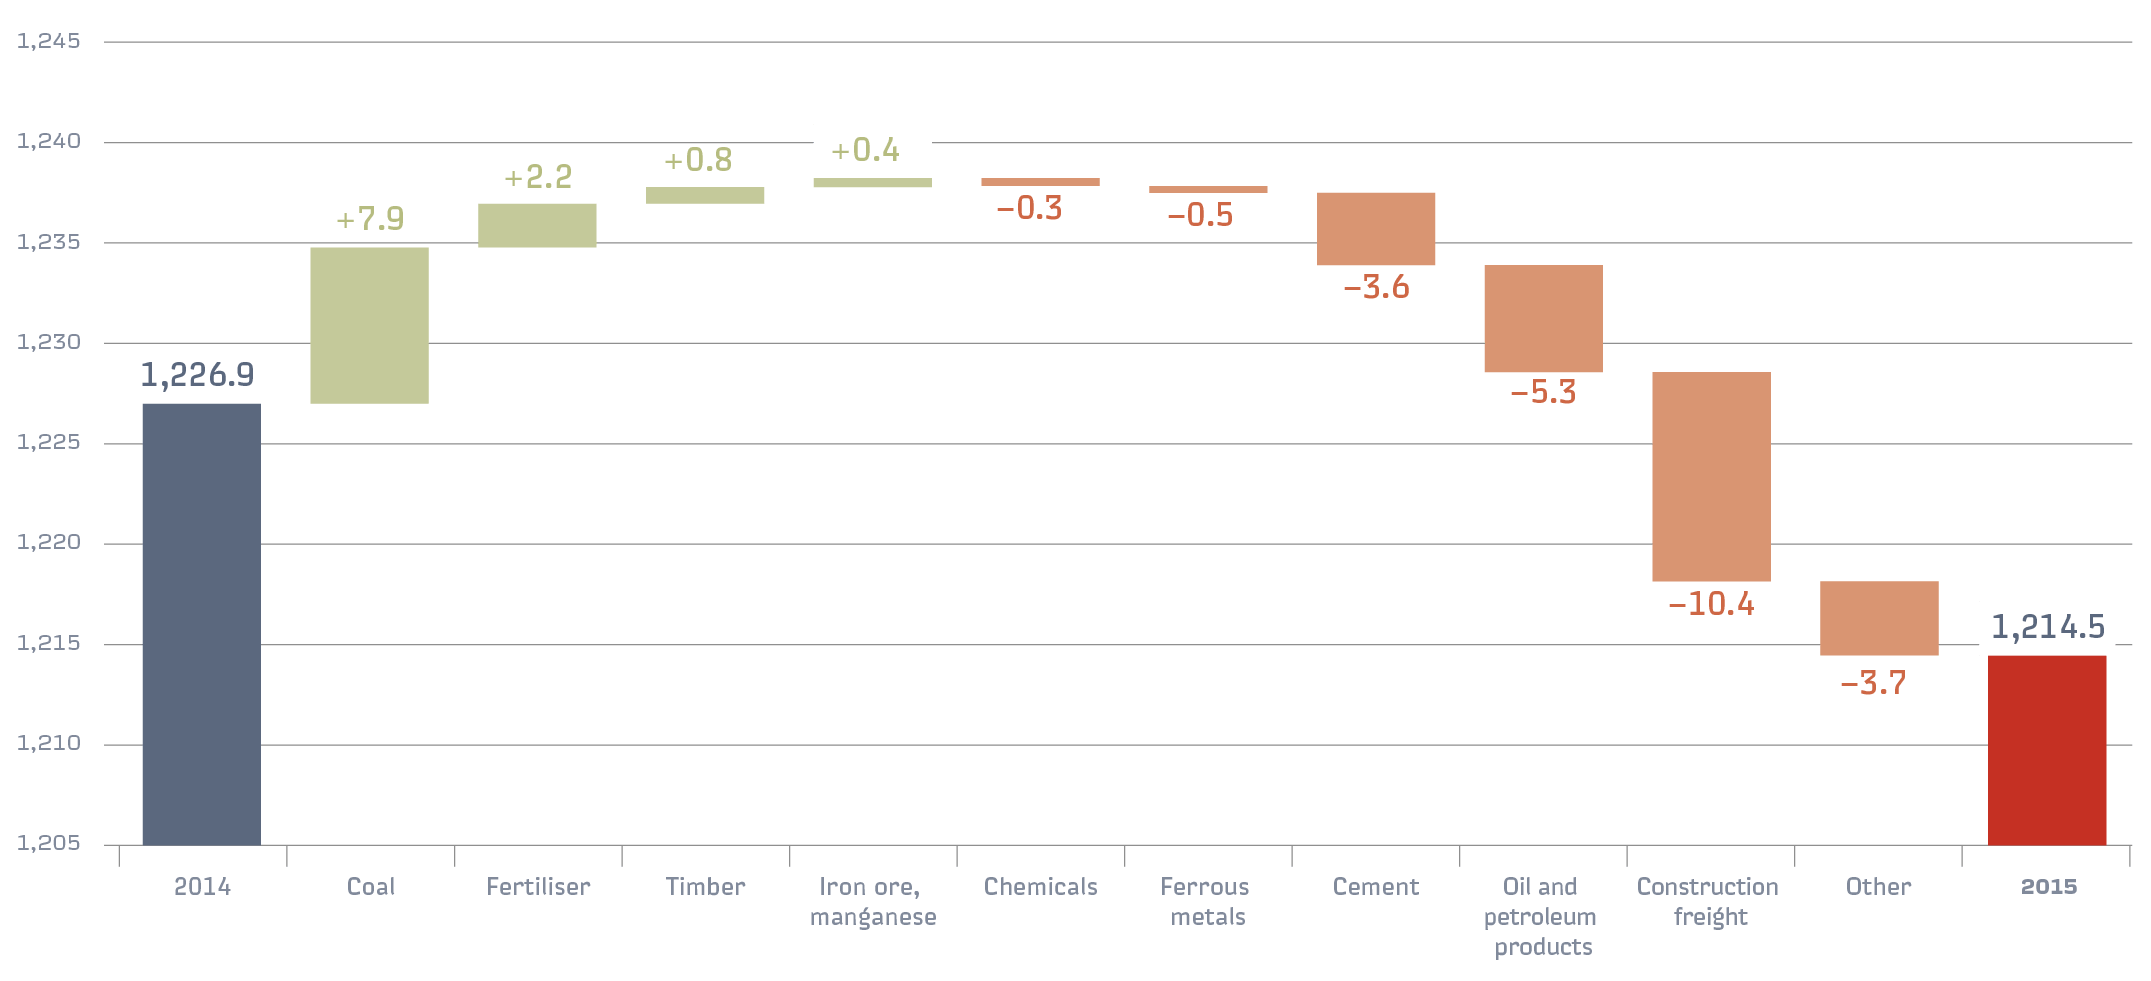
Given the challenging macroeconomic environment and decrease in the railway transportation freight base, the volume of freight handling on the railway network edged down 1% in 2015 compared with 2014.
The main reason for this was a reduction in the handling of construction materials and oil freight. For the year, freight handling totalled 1,214.5 mln tonnes (3,327,300 tonnes on average per day).
At the same time, freight handling for exports increased 4.3% compared to the previous year and totalled 420 mln tonnes, while the handling of domestic traffic declined 3.2% to 797.5 mln tonnes.
Decreased handling was seen both within Russia as well as for exports in 2015. However, the decrease in export handling was less significant at 0.2% (to 419.2 mln tonnes) versus 1.4% (to 786.4 mln tonnes) within Russia. As a consequence, the share of domestic traffic in the overall handling structure fell from 65% to 64.8% in 2015, while the proportion of exports increased from 34.2% to 34.5%.
The overall handling structure is dominated by coal, oil, petroleum products and construction freight. In 2015, these products made up 67% of total handling volume.
Handling was down for all freight classes in 2015. The biggest decrease among first-class tariff freight was seen in construction freight (-7.4%, or 10.4 mln tonnes); among second-class tariff freight — petroleum products (-2.1%, or 5.3 mln tonnes); and among third-class tariff freight — scrap metal (-10.1%, or 1.7 mln tonnes). At the same time, an increase was seen compared with 2014 in the handling of coal (+2.5%, or 7.9 mln tonnes), non-ferrous ore (+6.0%, or 1.2 mln tonnes) and fertiliser (+4.4%, or 2.2 mln tonnes).
Low margin freight makes up the greatest share of freight handling at 59.2%. Average-margin and high-margin freight make up 30.4% and 10.4%, respectively.
| Indicator | 2014 | 2015 | Change in volume, % |
||
|---|---|---|---|---|---|
| mln t | share, % | mln t | share, % | ||
| Handling | 1,226.9 | 100.0 | 1,214.5 | 100.0 | –1.0 |
| Domestic traffic | 797.5 | 65.0 | 786.4 | 64.8 | –1.4 |
| Export, including | 419.9 | 34.2 | 419.2 | 34.5 | –0.2 |
| via ports | 250.3 | 20.4 | 260.0 | 21.4 | 3.9 |
| via border crossings | 169.6 | 13.8 | 159.2 | 13.1 | –6.1 |
| Import and transit | 9.5 | 0.8 | 8.8 | 0.7 | –7.5 |
Freight turnover
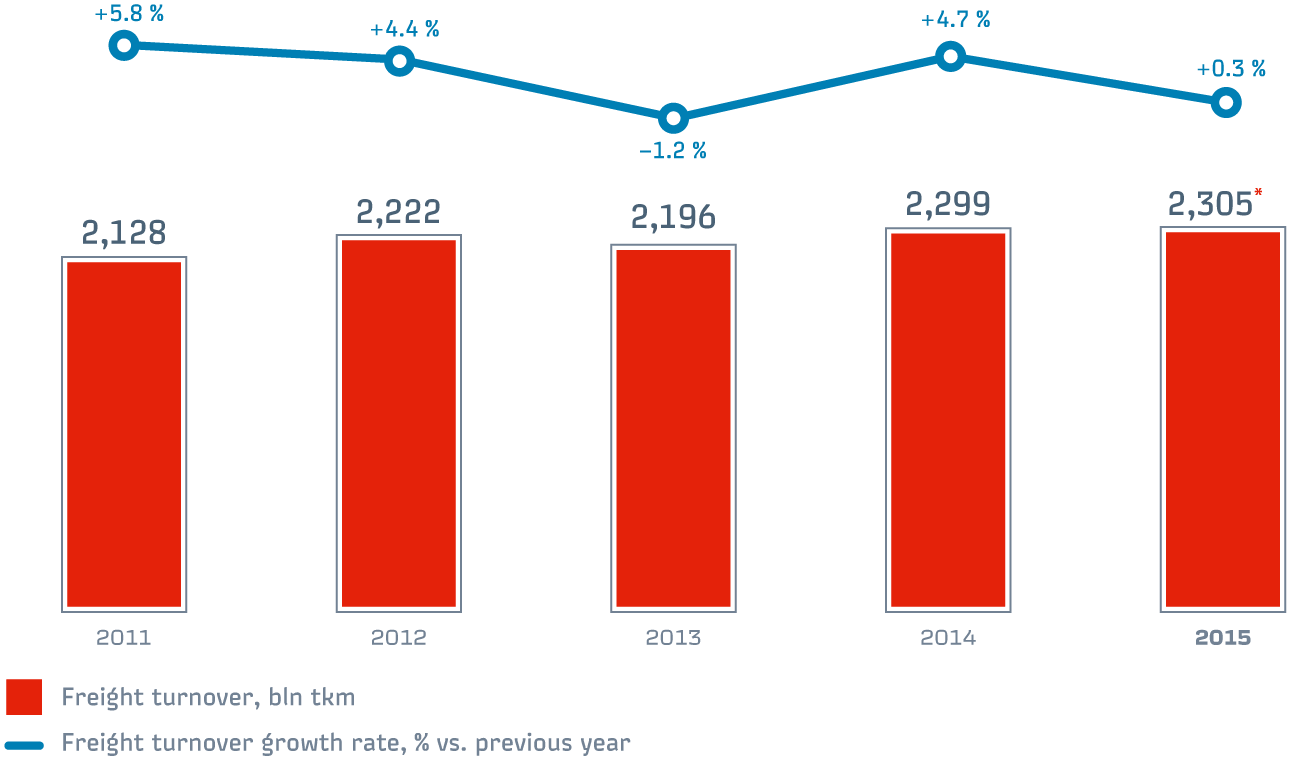
Loaded railway freight turnover grew 0.3% to 2,304.8 bln tkm in 2015.
Total freight turnover (including empty runs by the railcars of other owners) on Russian Railways infrastructure remained virtually unchanged compared with 2014 and totalled 2,954.9 bln tkm, while empty freight turnover declined 0.9% (to 650.1 bln tkm).
The positive dynamics in freight turnover combined with decreased handling volumes are attributable to growth in the average distance of freight transportation. The reduction in the volume of short-distance domestic and imported freight transportation was compensated by exports via port railway stations (by 34.0 bln tkm, or 4.3%).
In 2015, the average transportation distance was 1,570 km, which is 3.1%, or 46 km, more than the 2014 indicator, including 1,734 km for loaded shipments (up 4%) and 1,177 km in freight on its own axes (up 0.6%).
Domestically, loaded freight turnover declined 0.3% to 1,000.3 bln tkm. A decrease was also seen in import freight turnover (-14.8% to 84.5 bln tkm) and transit freight turnover (-7.7% to 48.6 bln tkm). Meanwhile, loaded freight turnover for export increased 2.4% to 1,171.4 bln tkm.
 *
rounded figures
*
rounded figures
| Indicator | 2014 | 2015 | Change, % |
|---|---|---|---|
| Loaded shipment | 1,668 | 1,734 | 4.0 |
| Empty shipment | 1,170 | 1,177 | 0.6 |
| Average total for network | 1,524 | 1,570 | 3.1 |
The changes led to a further reduction in the share of domestic shipments within the loaded freight turnover structure and growth in the share of exports.
Over the last five years, the share of export shipments in freight turnover increased 3.3 p.p. and reached 50.8% in 2015, while the share of domestic shipments declined to 43.4% by contrast.
Coal accounted for the lion’s share of loaded freight turnover in 2015 (39.2%, up 0.6 p.p. versus 2014) followed by petroleum products (19.3%, or the same as last year) and mineral and construction freight (8.8%, down 0.8 p.p.).